
I like Anscombe’s Quartet. It’s a good example of why visualisation of data is important to highlight when apparently similar data might actually be very different to each other. As Francis Anscombe pointed out in 1973, it is readily possible to have several data sets which have statistical measures (such as their mean and variance) that are basically the same but for which the underlying data have obviously quite different origins.
Here I merely replicate the data and plots, and make available a Mathematica notebook that demonstrates how to do the analysis.
The data is the same as from the Wikipedia article:
| x1 | y1 | x2 | y2 | x3 | y3 | x4 | y4 |
| 10 | 8.04 | 10 | 9.14 | 10 | 7.46 | 8 | 6.58 |
| 8 | 6.95 | 8 | 8.14 | 8 | 6.77 | 8 | 5.76 |
| 13 | 7.58 | 13 | 8.74 | 13 | 12.74 | 8 | 7.71 |
| 9 | 8.81 | 9 | 8.77 | 9 | 7.11 | 8 | 8.84 |
| 11 | 8.33 | 11 | 9.26 | 11 | 7.81 | 8 | 8.47 |
| 14 | 9.96 | 14 | 8.1 | 14 | 8.84 | 8 | 7.04 |
| 6 | 7.24 | 6 | 6.13 | 6 | 6.08 | 8 | 5.25 |
| 4 | 4.26 | 4 | 3.1 | 4 | 5.39 | 19 | 12.5 |
| 12 | 10.84 | 12 | 9.13 | 12 | 8.15 | 8 | 5.56 |
| 7 | 4.82 | 7 | 7.26 | 7 | 6.42 | 8 | 7.91 |
| 5 | 5.68 | 5 | 4.74 | 5 | 5.73 | 8 | 6.89 |
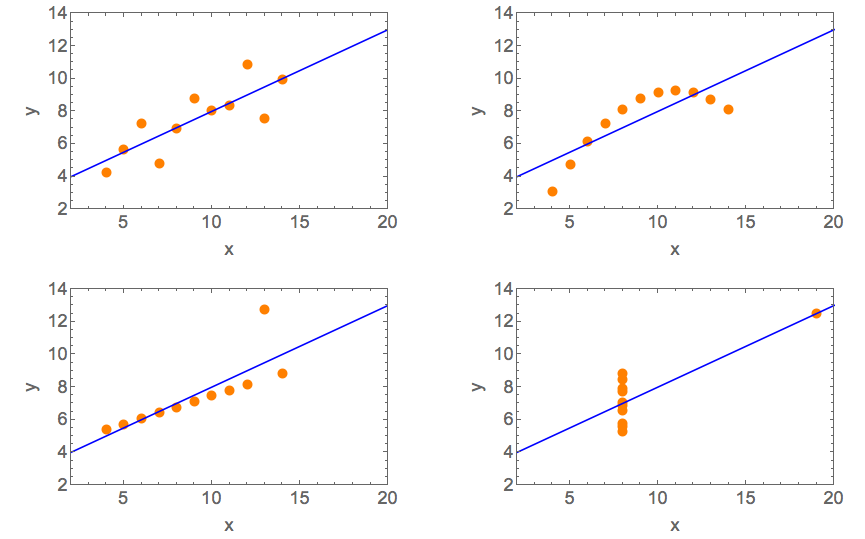
The data is visualised in these plots, which show how different they really are despite having very similar statistical properties:
The Mathematica file is available here, or you can try the code out online here.